Using formulas to control object properties
One of the biggest features that formulas have is that you can use formulas to control the property values of objects at runtime. This provides you much more control, allowing you to customize your report and have flexibility to control the way objects are displayed based on the data values. For web reports and library components, only the Invisible property can be controlled by formulas.
When you edit the property values of an object in the Report Inspector, you may notice that if you click some properties, there will be a button  appearing on the right of the drop-down arrow, and when you click this button, it will change to be another button
  and also the value cell will become empty. Then when you click the drop-down arrow, a drop-down menu will be listed. If you select one item in the list, the property will be controlled according to the return value of the formula. Meanwhile, you will also find the button next to the value text boxes of some options in certain dialogs (like the Display Type dialog). You can use formulas to control the options in the same way you do to properties.
Notes:
- Usually when you open the drop-down list of this kind of property, there is no formula to be selected directly unless:
- For page report
You have created some formulas in the same catalog before building the report, and the formulas are created in the same data source connection as the query on which your report is going to built. You can also click the <Create Formula> item in the drop-down list to create one as required. For a crosstab in a page report, if you have created some crosstab formulas in the crosstab, they are also available in the drop-down list. You can click the <Create Crosstab Formula> item in the drop-down list to create one too.
- For web report and library component
You have created some dynamic formulas in the corresponding business view. For details, see Using formulas to control showing or hiding components.
- When you are composing a new formula that directly binds to a property using the Report Inspector, make sure the data type of the return value is the same as the property type. Otherwise, the new formula will not be bound to this property, although it will be created in the catalog data source.
Example: Changing the banded panel background color at runtime
This example uses the formula MColor to control the Background property of the detail panel of a banded report at runtime. You can find this formula in Data Source 1 of the catalog SampleReports. The following is the content of the formula:
String sc = "" + (@MColor_RecordNumber *10 );
Number idx = InStr(".",sc);
if(idx != -1)
          sc = Left(sc, idx);
if(Length(sc) < 2)
          sc = "0" + sc;
String s = "0x00" + sc + "7f";
return s
|
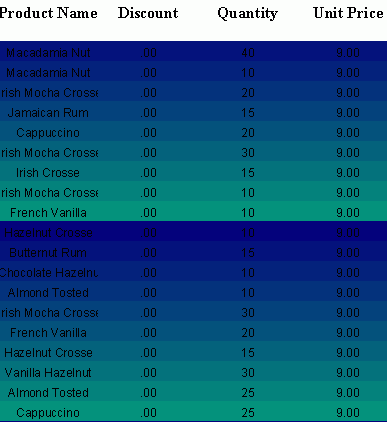
In this example we will vary the middle hexadecimal digits of the RGB color values. The Red value is fixed at 0x00, the Blue value is fixed at 0x7f. The Green value will change according to the number of records displayed. Record 1 will use color 0x00107f, Record 2 will use 0x00207f, and so on.
Take the following steps:
- Make sure the currently open catalog is SampleReports. If not, open the catalog.
- Create a standard banded report with a query stored in Data Source 1 of the catalog.
- In the design area, select the detail panel (DP) of the banded object.
- In the Properties panel of the Report Inspector, click the value cell of the property Background, and click . From the drop-down list, select MColor.
- Click the View tab to view the report. The report will be shown somewhat as follows, depending on the report you use.