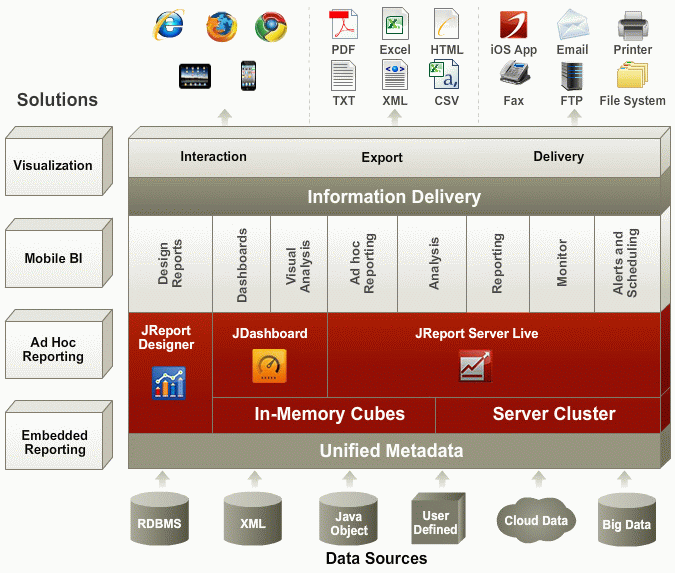

JReport delivers operational business intelligence to enterprise applications through powerful embedded reporting.
JReport is a complete Java reporting solution that provides sophisticated enterprise reporting, ad hoc reporting, and data analysis. A 100% Java EE architecture and a rich set of APIs allow JReport to be seamlessly embedded into any application, providing end users with a transparent interface to easily generate reports, share information, and analyze data. With JReport, any report can be made interactive, extending the "life" of a report by allowing users to easily sort, group, navigate, and filter via the Web. This wide range of functionality, including the ability to drill down on data, enables users to quickly derive value from their business intelligence.
JReport's Java architecture takes advantage of the portability, scalability, and ease of integration associated with J2EE technology to provide a powerful, flexible reporting solution that fits perfectly within any architecture.

JReport Designer is a Swing-based Integrated Development Environment (IDE) that enables sophisticated report design and presentation of critical business data. It provides an intuitive interface, reusable report components, flexible layout, and a toolset for designing and testing reports. With JReport Designer, you can build reports using simple drag and drop techniques or by using the Report Wizard. Data can be accessed from any data source to design and preview reports in order to deliver information to end users in the most relevant and intuitive manner. Rapid creation and modification of report templates is accomplished by toggling between design mode and view mode where the report will be displayed with the actual dataset. Once report design is complete, the template is published to the JReport Server for generation, delivery, and management.
JReport Server is a 100% Java report generation and management tool. It enables efficient management, sharing, scheduling, versioning, and delivery of reports and enables reporting to be integrated into the workflow of any Java application. The high-performance engine can scale to any workload. Report results can be saved to a versioning system, sent to enterprise/workgroup printers, or e-mailed. With JReport, reports can be viewed in any modern enterprise format including Page Report, Web Report, HTML and standard business documents, such as PDF, Excel, and RTF.
JDashboard delivers information using a user portal user interface rather than a report. Users can freely choose the objects they want to display in the dashboard, without having to know how these objects were created, what data sources to use, what styles to set, etc. A dashboard can hold multiple data components so that when browsing the dashboard users are able to see multiple data aspects. Within a dashboard, data components are able to communicate with each other via the message mechanism. This allows actions such as common filters to be applied to all the components of a dashboard even when coming from different data sources.
Page Report Studio and Web Report Studio enable reports to be accessed through a web browser via Dynamic HTML, or AJAX. With Page Report Studio and Web Report Studio, reports can be modified using dynamic filter, sort, and drill capabilities. Using Page Report Studio and Web Report Studio's advanced capabilities, users can drag and drop columns to and from an existing report, dynamically change chart types, pivot crosstabs, add groups, convert report components or create an entirely new report.
Visual Analysis is a WYSIWYG product to visualize the result of every step of your work. Simply by dragging and dropping data fields to the layout module, users are able to experience the detailed building up of crosstabs and charts step by step visually. The use of colors, sizes, shapes, and pie slices demonstrates the data in rich aspects.
If you are having trouble running JReport Designer or encounter any problems during reporting, take the following steps to troubleshoot it yourself first:
Note: You need to install the JDBC or ODBC driver before installing JReport Designer. For more information about how to install the driver please refer to the appropriate JDBC or ODBC manuals.
For more information, see Setting up the JDBC driver.
If the problem persists, report it to Jinfonet Support (support@jinfonet.com) with the following information:
<install_root>\bin folder, which will generate a file called report.env in the current directory. Send this file to us.<install_root>\logs directory. Try to reproduce the problem, and send this log file to us.To extract the report data, in the Catalog Browser, right-click on the data object that your report is using, select Create Cached Query Result. Input the data file name and click the Save button. The query result will be saved in the file. Send us all the files <file name>.* (including the description file also). If the primary report contains subreports, repeat this also for each subreport.