

Summary functions
The following are functions that can be used for creating summaries. They are divided into two types: normal functions and running functions.
A normal function calculates all records and returns only one fixed value.
A running function calculates a value on each record dynamically. It is like the total sum of money for each transaction that is recorded on your checkbook. Each time you deposit or withdraw money from the bank, the record will compute the total of your checking account balance.
- Count
Total count of all the values in a field. The value will be shown in the Group Footer. For example, if you have six fields in a group, the value generated by Count will be 6.
- Sum
This function sums up all the numerical values in a field. The value will be shown in the Group Footer. For example, if a field contains 5, 10, 15, 20 and 25, the Sum function will return 75.
- Minimum
This function finds the smallest numerical value in a field. The value will be shown in the Group Footer. For example, if a field contains 5, 10, 15, 20, and 25, the Minimum function will return 5.
- Maximum
This function finds the largest numerical value in a field. The value will be shown in the Group Footer. For example, if a field contains 5, 10, 15, 20, and 25, the Maximum function will return 25.
- Average
This function takes the average of all the numerical values in a field. The value will be shown in the Group Footer. For example, if a field contains 5, 10, 15, 20, and 25, the Average function will return 15.
- Distinct Count
This function takes a total count of all the distinct fields in a report. This value will be shown in the Report Footer. For example, if you have forty three fields in your report and three fields have identical values, the value generated by Distinct Count will be 41.
- Population Standard Deviation
This function uses the following equation to compute its value. PSD takes the square root of the Population Variance.

- Standard Deviation
This function uses the following equation to compute its value. SD takes the square root of the Variance.

- Population Variance
This function uses the following equation. PV sums up the square of the difference between a value and its average, and then divides the result by the total number of values.

- Variance
This function uses the following equation. Variance sums up the square of the difference between a value and its average, and then divides the result by the total number of values subtracted by one.

- Running Count
This function takes a total count on running records of the values in a field.
- Running Distinct Count
This function takes a total count of all the distinct fields in a report on running records.
- Running Sum
This function sums up all the numerical values in a field on running records.
- Running Minimum
This function finds the smallest numerical value in a field on running records.
- Running Maximum
This function finds the largest numerical value in a field on running records.
- Running Average
This function takes the average of all the numerical values in a field on running records.
Examples
The following are two examples comparing normal functions and running functions.
Sum on banded object
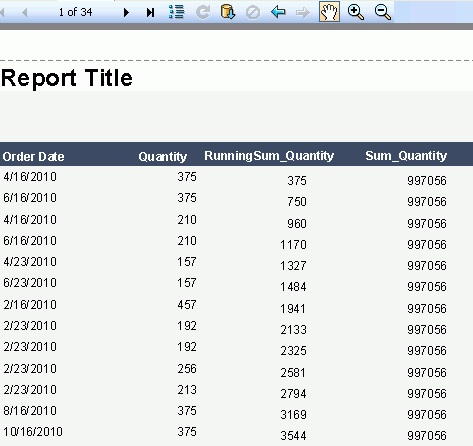
Summaries can be added in a banded object as columns which makes the comparison quite obvious.
The first page of a banded object:
The last page of the banded object:
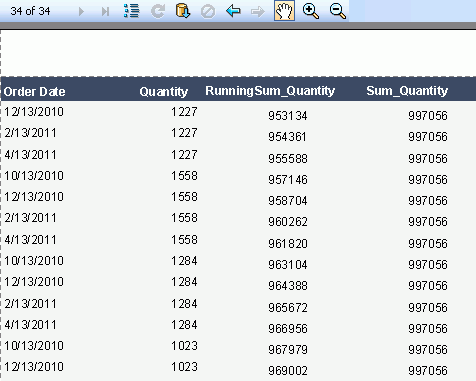
As revealed in the first and last pages of the banded object, the sum on quantity is always the same value which is a total quantity of all the records, while running sum on quantity is the current accumulated value on each row.
Sum on crosstab
- Create two dynamic aggregations in a blank web report:
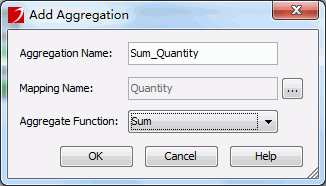
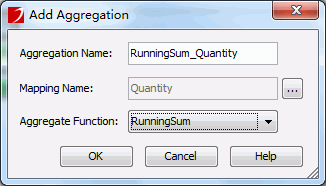
- Create a crosstab as follows. Use the two dynamic aggregations created just now as the summary fields.
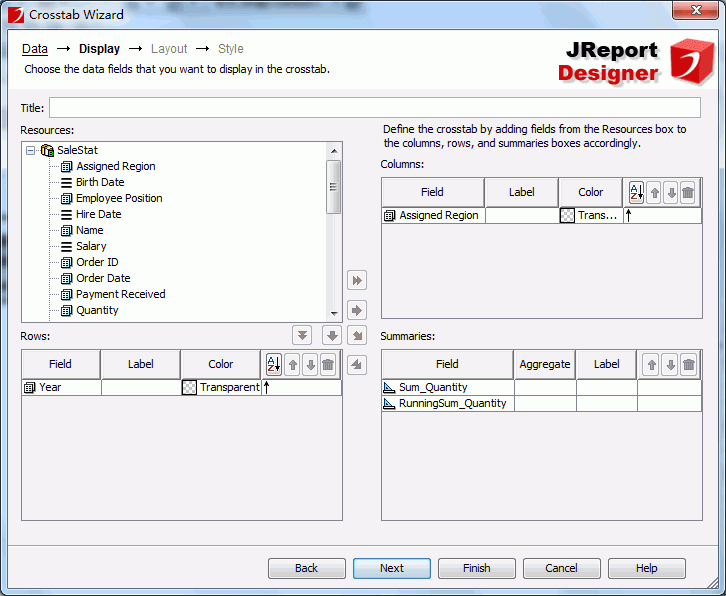
- The running sum values are highlighted in green for easier comparison.
Note that the running functionality is only for columns of the crosstab, it does not do running totals on the rows.


