

The Jinfonet Gourmet Java company receives orders from customers in different territories around the world, and by reviewing this shipping information the Shipping department can receive bids from various shipping vendors. You are assigned the task of creating a shipment information report. In the report, the shipment details, including order ID, order date, ship date, shipping cost, whether the payment has been received, and the shipping vendor, need to be reported for each territory.
The following prototype of the report has been given to you:
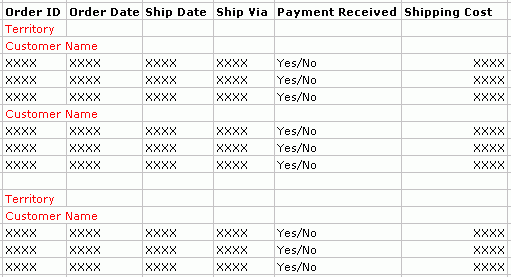
This report will be run online, so an interactive report will work well. Interactive reports allow the end user to change the view of the report. They can filter the data on the report or change the sort order, as well as search the report.
This lesson contains the following tasks:
Before taking this task, make sure you have enabled the Insert field name label with field option in the Options dialog as noted at the end of Lesson 3. Otherwise, the name labels will not be inserted together with the fields when you add fields to the table.
 .
.Be sure that JinfonetGourmetJava.cat is specified as the current catalog because it is the catalog we use in this track. For information about specifying this catalog, see Task 1, Step 2 of Lesson 1.
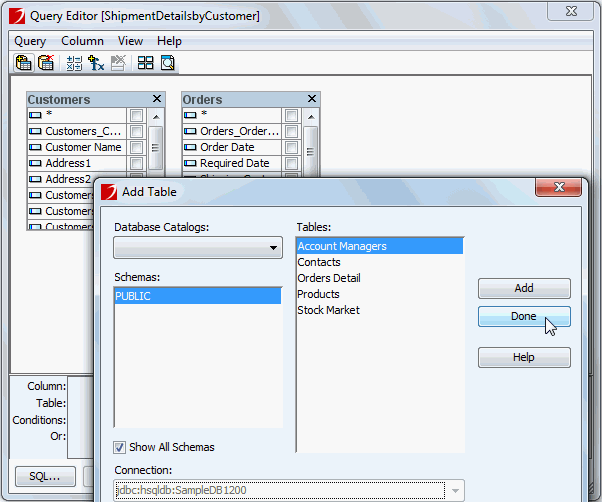
The two tables are then joined together automatically on the Customers_Customer ID and CustomerID_FK1 columns.
By default, the records in a table are displayed randomly; they are displayed in the order they are returned from the fetch operation. You can specify that JReport sort the records in a table, and also within the groups in table if any, according to your requirement. In this lesson, we will make the records in the table sorted by order ID ascendingly.
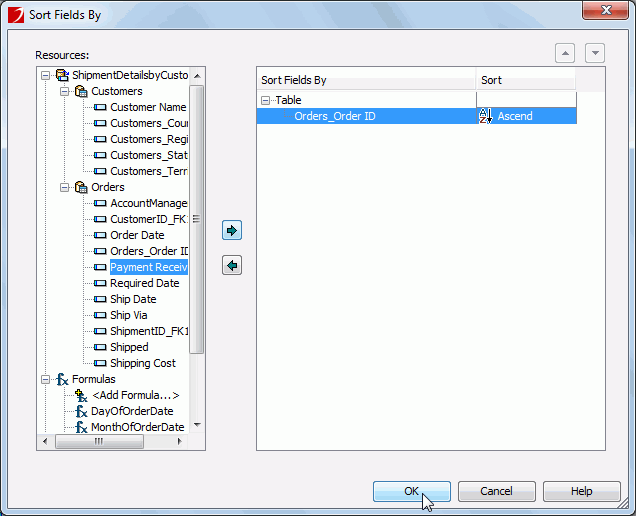
Click Next in the Table Wizard to display the Group screen.
Since the report is required to display shipment details of each customer in specific territory, we will add two groups to it: first group the report by territory and then by customer name.
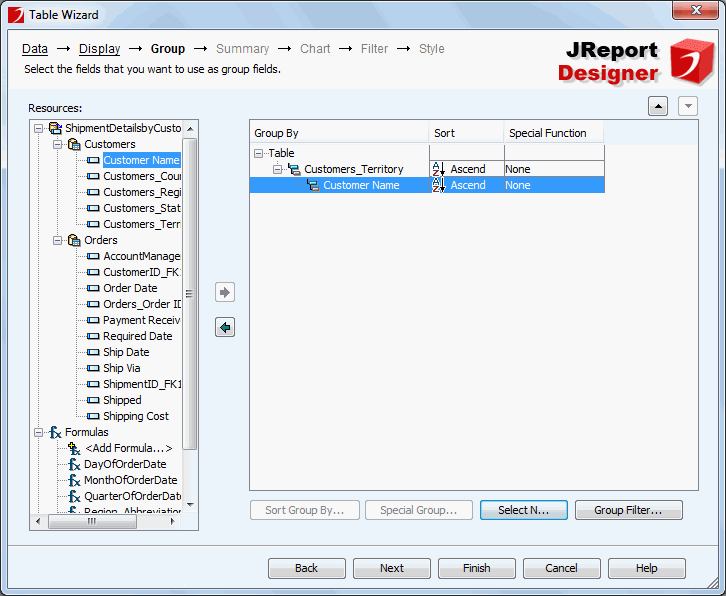
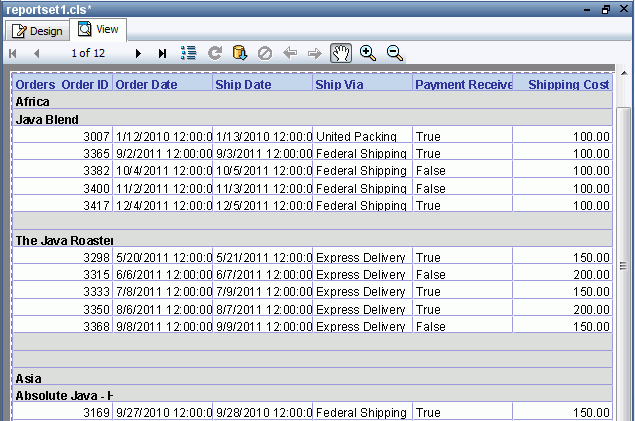
The required report has been created, but it is cumbersome to locate the shipment details of specific territories. So our next task is to add web controls to the report so that the end user can easily filter the results of the report.
Web controls empower end users of interactive reports to easily modify the report results they are viewing, and are defined by a trigger event, such as click, and a resulting web action.
In this task, we add a Drop-down List web control to the PageHeader panel of the report. It will be used to filter the report records by territory.
 in it to display the Insert Fields dialog.
 in the Actions cell.
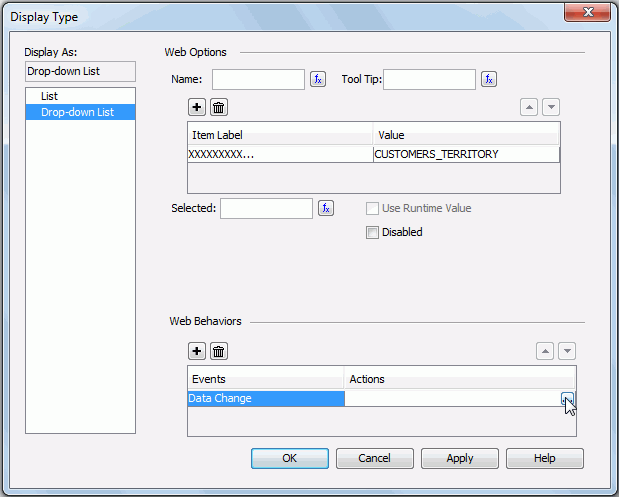
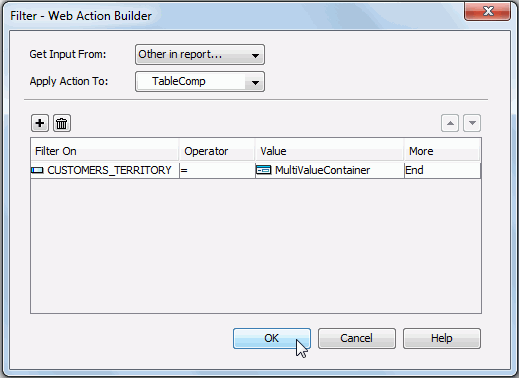
In this lesson, we will not explain the web actions and their parameters in detail. You can refer to Applying web actions in the Components chapter of the JReport Designer User's Guide for assistance.
By now, we have finished defining values of the web control. Next we will add a label ahead of it for identification, and a report title to the report.


Next, we will apply a different background color to the GroupHeader panels to make them distinguished from the TableHeader panel and hide the second GroupFooter panel to improve the layout of the report.

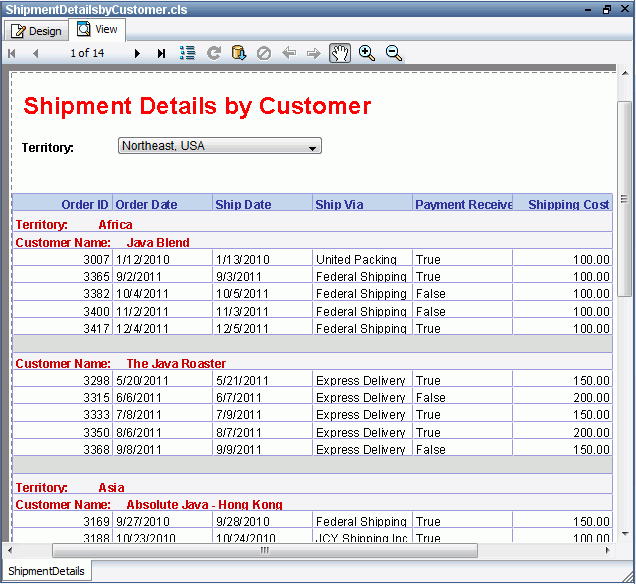
Note: If the report does not look correct, you can compare it to the final version of the report provided by JReport. To do so, you will need to save and close this catalog and then open the JinfonetGourmetJava.cat catalog file located at <install_root>\Demo\Reports\TutorialReports.
The web controls are powered by Page Report Studio and therefore cannot be previewed in JReport Designer. We can use the Preview as Page Report Result command of JReport Designer to preview this report, however, this command is enabled only if the option Server for Previewing Reports was specified when installing JReport Designer.
Click View > Preview As > Page Report Result. The report will then be opened in a web browser. Now we can select values from the drop-down list to dynamically change the report results. In the report below, we choose to view records in the Mexico territory.
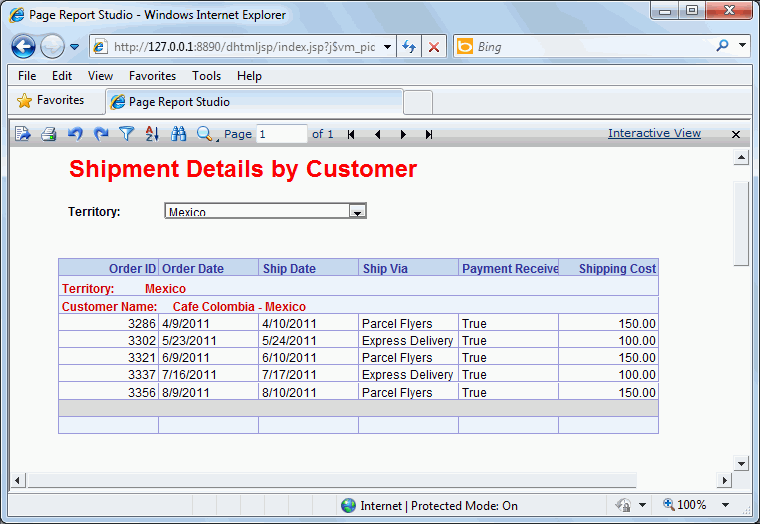
In this lesson, we created a shipment details report in the table report layout. In the report, we used a table container to format the data, and a web control to dynamically change the report results.