Web Report Wizard
This wizard appears after you click Menu > File > New Report (or the New Report button  on the Standard toolbar). It guides you through the process of creating a web report, and contains the following screens:

Displays this help document.
Back
Goes back to the previous screen.
Next
Goes to the next screen.
Save
Saves the report to the server resource tree.
Run
Opens the report in Web Report Studio.
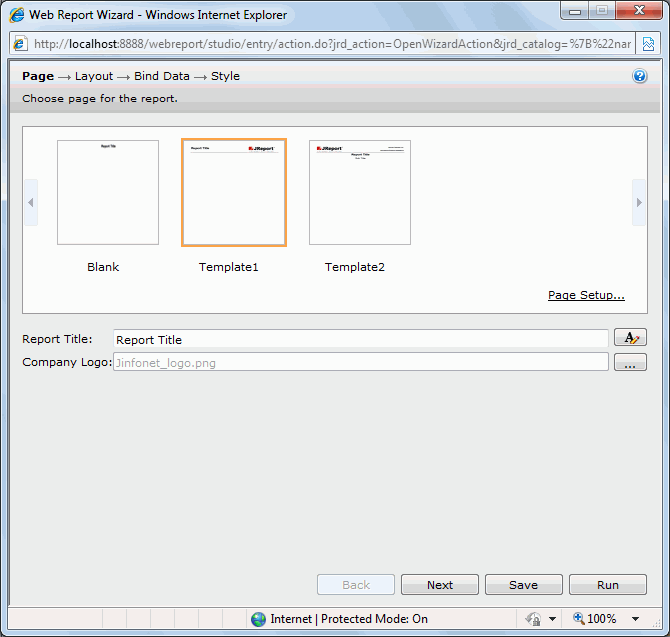
Page screen
Specifies the page settings of the report. See the screen.
Templates
Specifies the template to be applied to the report.
- Blank
Specifies to use the blank template.
- Template1
Specifies to use Template1, in which you can specify the report title and company logo.
- Template2
Specifies to use Template2, in which you can specify the company logo, company title, report title and sub title.
Page Setup
Opens the Page Setup dialog to specify the page properties.
Report Title
Specifies the display name of the report title.
Company Logo
Specifies the company logo image file.
Company Title 1
Specifies the display name of the company title 1.
Company Title 2
Specifies the display name of the company title 2.
Sub Title
Specifies the display name of the sub title.

Specifies the font properties for report title, sub title or company title.
- Font
Lists all the available font faces that can be selected to apply to the title.
- Font Style
Specifies the font style of the title. It can be one of the following: plain, bold, italic, and bold italic.
- Size
Specifies the font size of the title.
- Align
Specifies the position of the title to be left, right, center or justify.
- Font Color
Specifies the font color of the title.
- Background Color
Specifies the background color of the title.

Opens the Insert Image dialog to customize the image for company logo.
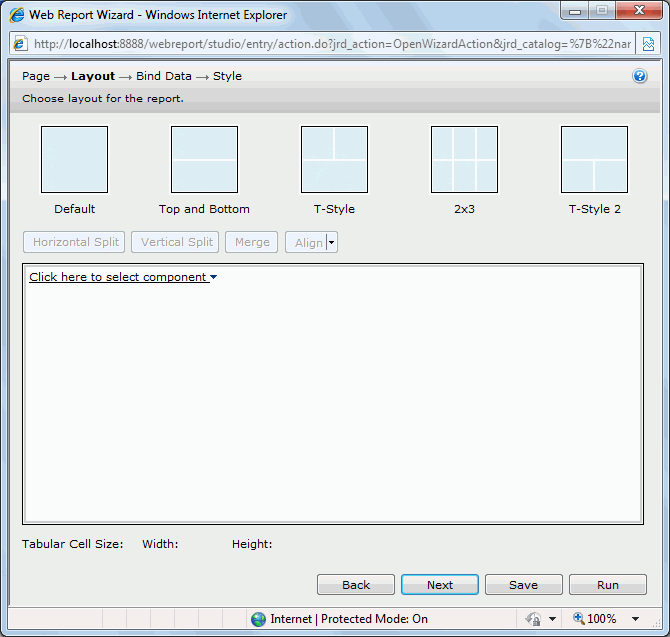
Layout screen
Specifies the layout of the report. See the screen.
Built-in layouts
Lists the built-in layouts.
- Default
There is only a cell in the tabular.
- Top and Bottom
There are two cells in the tabular. One is at the top, and the other is at the bottom. Each cell uses half the height of the tabular.
- T-Style
There are two rows in the tabular. Each row uses half the height of the tabular. The top row has two cells with each using half the width of the row, and the bottom row has only a cell.
- 2×3
There are six cells in the tabular. Each cell uses one third the height and one third the width of the tabular.
- T-Style 2
There are two rows in the tabular. Each row uses half the height of the tabular. The top row has only a cell, and the bottom row has two cells with each using half the width of the row.
Toolbar
The toolbar is enabled when a tabular cell in the below edit layout box is selected.
- Horizontal Split
Splits the selected tabular cell into two cells horizontally.
- Vertical Split
Splits the selected tabular cell into two cells vertically.
- Merge
Merges the selected adjacent tabular cells that form a rectangular into one cell.
- Align
Specifies how the component aligns in the tabular cell.
- Left
Aligns the component to the left of the tabular cell.
- Center
Aligns the component to the center of the tabular cell.
- Right
Aligns the component to the right of the tabular cell.
Edit layout box
Specifies the component to be inserted into the selected tabular cell.
- Existing Components
Specifies a component from the ones existing in the open report to create the report.
- New Components
Specifies the component you want to place in the tabular cell.
- Table
Creates a table in the tabular cell.
- Crosstab
Creates a crosstab in the tabular cell.
- Chart
Creates a chart in the tabular cell.
- Blank
Creates nothing in the tabular cell.
Tabular Cell Size
Displays the size of the selected tabular cell, in percent.
- Width
Shows the width of the tabular cell.
- Height
Shows the height of the tabular cell.
Bind Data screen
Specifies the data source and the fields to be displayed in each component selected in the Layout screen. This screen differs according to the following component types: table, crosstab, chart. When the component type is specified as Blank, the screen is disabled.
For table component
Specifies the data displayed in the table. See the screen.
Table Title
Specifies the title of the table. The title is a special label bound with the table. Though it can be positioned freely in a report, once you remove the table from the report, the title will be removed too.
Specifies the font properties of the table title.
Data Source
Specifies the business view in the current catalog on which the table will be built.
Filter
Opens the Query Filter dialog to specify the filter you want to apply to the selected business view.
Table Type
Specifies the table type.
- Group Above
Creates a table with group information above the detail panel.
- Group Left
Creates a table with group information left to the detail panel.
- Group Left Above
Creates a table with group information left above the detail panel.
- Summary Table
Creates a table with only group and summary information.
Display tab
Specifies the fields to be displayed in the table.
- Resources
Displays all the view elements in the selected business view.

Edits the selected dynamic resource.
Removes the selected dynamic resource.
Adds the selected view element to be displayed in the table.
Removes the selected view element.- Field
Lists the view elements that have been added to the table.
- Label
Specifies the display names of the added view elements.

Moves the selected view element one step up.
Moves the selected view element one step down.
Group tab
Specifies the fields to group the data.
- Resources
Displays all the available group objects  you can use to group data in the table.
Adds the selected group object as a group by field.
Removes the selected group object.- Field
Lists all the group objects that have been added as the group by fields.
- Sort
Specifies the sort order for each group: Ascending, Descending, or No Sort.
Moves the selected group object one step up.
Moves the selected group object one step down.
Summary tab
Specifies the fields on which to create summaries.
- Resources
Displays all the available aggregation objects  you can use to create summaries in the table.
Edits the selected dynamic resource.
Removes the selected dynamic resource.
Adds the selected aggregation object as the summary field.
Removes the selected aggregation object.- Field
Lists the groups that have been added in the table and the aggregation objects added to summarize data in each group.
- Row
Specifies to put the summary field in the header or footer row. If the summary is calculated on a group by field, it will be put in the group header or footer row of the corresponding group; if the summary is calculated on the whole dataset, it will be put in the table header or footer row. Available only when the table is Group Left type.
- Column
Specifies to put the summary field in the specified detail column. Available only when the table is Group Left type.
Moves the selected aggregation object one step up.
Moves the selected aggregation object one step down.
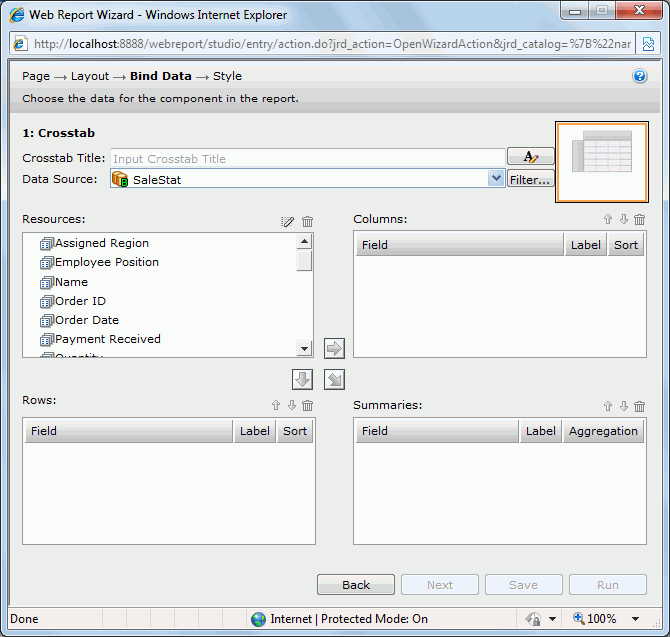
For crosstab component
Specifies the data displayed in the crosstab. See the screen.
Crosstab Title
Specifies the title of the crosstab. The title is a special label bound with the crosstab. Though it can be positioned freely in a report, once you remove the crosstab from the report, the title will be removed too.
Specifies the font properties of the crosstab title.
Data Source
Specifies the business view in the current catalog on which the crosstab will be built.
Filter
Opens the Query Filter dialog to specify the filter you want to apply to the selected business view.
Resources
Displays the elements in the selected business view.
Edits the selected dynamic resource.
Adds the selected group object to be displayed on the columns of the crosstab.

Adds the selected group object to be displayed on the rows of the crosstab.

Adds the selected aggregation object and detail object  to be the summary field of the crosstab.
Columns/Rows
- Field
Lists the group objects that will be displayed on the columns/rows of the crosstab.
- Label
Specifies the display names of the group objects. By default these are blank and no names will be created for the group objects to label the columns/rows. You can double-click the cells to edit them if required.
- Sort
Specifies the sort order of the group objects.
Summaries
- Field
Lists the aggregation/detail objects that you select to create summaries.
- Label
Specifies the display names of the aggregation/detail objects. By default these are blank and no names will be created for the objects to label the summaries. You can click in the cells to edit them if required.
- Aggregation
Specifies the functions used to summarize data of the detail objects.
Moves the selected view element one level up.
Moves the selected view element one level down.
Removes the selected view element.
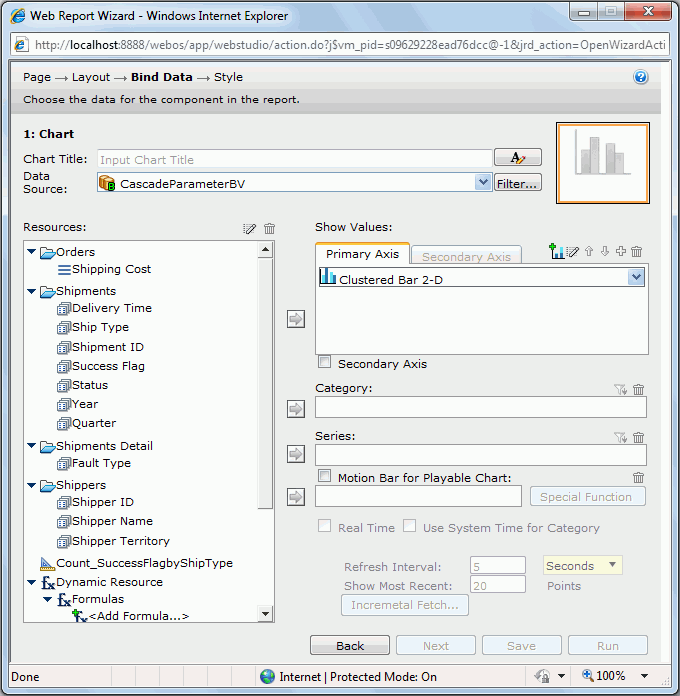
For chart component
The screen for the chart component varies with different chart types: common chart types, organization chart, heat map.
For common chart types
Specifies the data displayed in the chart. See the screen.
- Chart Title
Specifies the title of the chart. The title is a special label bound with the chart. Though it can be positioned freely in a report, once you remove the chart from the report, the title will be removed too.
Specifies the font properties of the chart title. - Data Source
Specifies the business view in the current catalog on which the chart will be built.
- Filter
Opens the Query Filter dialog to specify the filter you want to apply to the selected business view.
- Resources
Displays the view elements in the selected business view.
Edits the selected dynamic resource.
Removes the selected dynamic resource.
Adds the selected resource to be displayed in the chart.- Show Values
Lists the values you want to show in the chart. For a real time chart, the values you add must be of Numeric type and cannot be aggregation objects.
- Primary Axis
Adds a chart type to the primary axis.
- Secondary Axis
Adds a chart type to the secondary axis. Active only when the option Secondary Axis is checked.
- X Axis
Lists the value you want to show on the X axis of the bubble chart.
- Y Axis
Lists the value you want to show on the Y axis of the bubble chart.
- Radius
Lists the value you want to show as the bubble radius.

Adds a combo chart to the Primary Axis or Secondary Axis.
Opens the Edit Additional Value dialog to edit the selected additional value.-
Moves the selected view element one level up.
Moves the selected view element one level down.
Adds a new pair of Y Axis and Radius for the bubble chart.
Removes the selected resource.- Secondary Axis
Specifies whether to show the secondary axis in the chart.
- Category
Lists the group object that will be displayed on the category axis of the chart.
For a real time chart, if no object is specified on the category axis, Use System Refresh Time will be automatically displayed in the Category text box, namely, the time at which the chart refreshes itself will be used as the category value.
- Series
Lists the group object that will be displayed on the series axis of the chart. Not available to real time chart.

Opens the Category Options dialog or Series Options dialog to define the sort order of the category or series values and specify the number of the category or series values that will be displayed in the chart.- Motion Bar for Playable Chart
Lists the group object you want to use as the motion field. A motion field can only be of Integer, Date or Time data type. Available to single bar, bench and bubble chart types only.
- Special Function
Available only when the motion field is of Date data type. Click it to define the special function.
- Field
Displays on which field the special function will be applied.
- Function
Specifies the special function to the field.
- OK
Accepts the special function settings and leaves the dialog.
- Cancel
Cancels the special function settings and leaves the dialog.
- Real Time
Specifies to run the chart in real time mode, which means it will be updated automatically by using real time data. Available to single bar, bench, line, and area chart types only.
- Use System Time for Category
Specifies to use the time at which the chart refreshes itself as the category value.
- Refresh Interval
Specifies the time interval at which the chart will get data and refresh itself automatically.
- Show Most Recent N Points
Specifies the number of records that will be kept for the real time data on the chart.
- Incremental Fetch
Opens the Unique Key dialog to configure a unique key for the real time chart.
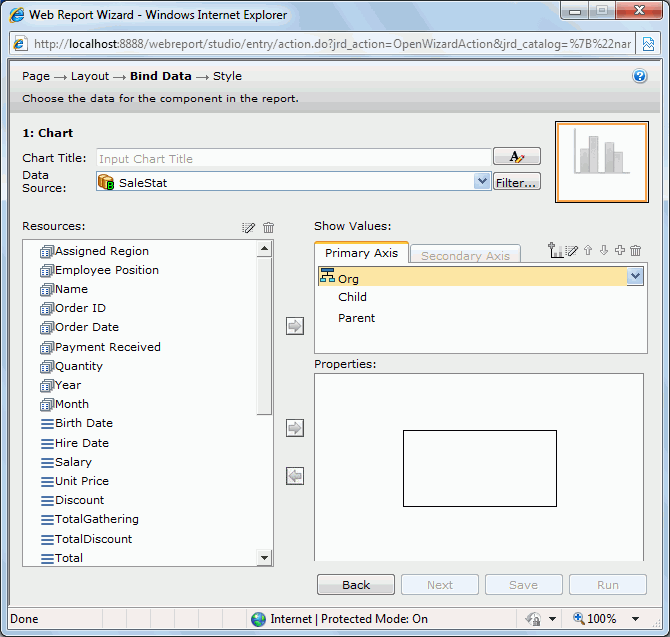
For organization chart
Specifies the data displayed in the chart. See the screen.
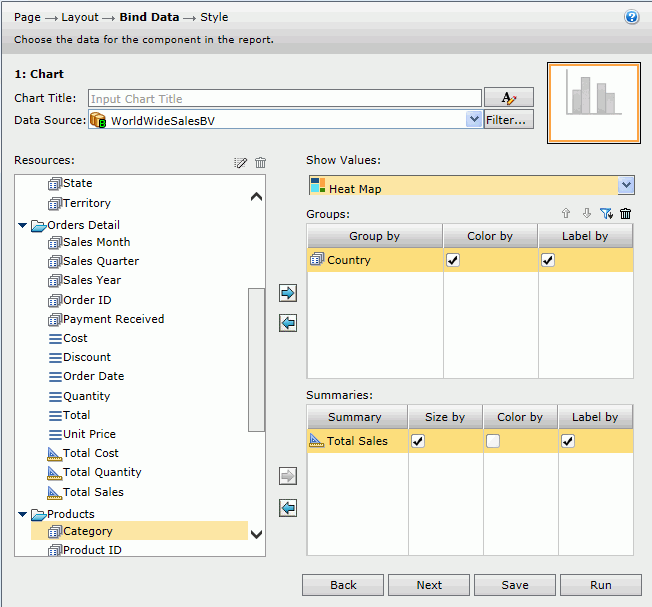
For heat map
Specifies the data displayed in the chart. See the screen.
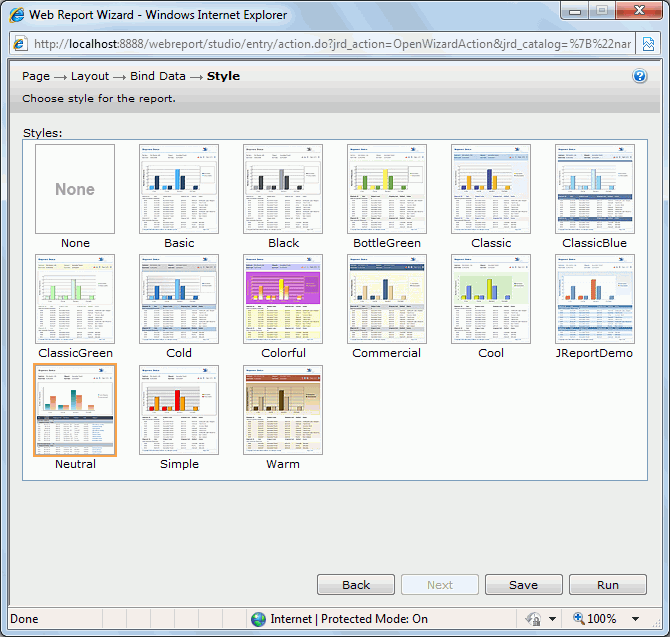
Style screen
Specifies the style of the report. See the screen.
Styles
Lists all the available styles for you to select from. No style will be applied when you select None.