
The previous lesson described how to perform data analysis on ad hoc reports. However, data analysis can also be performed on published dynamic reports, that is to say, the page reports were built in JReport Designer. For dynamic reports to support data analysis, the components in the report must have a report cube built in the same query with the component. The report cube must reside in the same published catalog with the dynamic report.
Take the banded object created in Lesson 8 of Track 2 for example, it has a group field Orders_Order ID and four detail fields Customer Name, Order Date, Last Name and Payment Received, and the banded object is based on the OrdersReport dataset which originates from the OrdersReport imported SQL file. As you know from Lesson 2 of Track 3, this imported SQL file contains the report cube OrdersReport_ReportCube. The report cube includes the dimension objects Order ID, Name, Sales Date, Last Name, and the detail information object Payment Received, which correspond to the group field and detail fields of the banded object respectively, in other words, the fields in the banded object can be mapped into the corresponding cube elements.
This lesson guides you to perform data analysis on the banded object.
First we will adjust the structure of the banded object.
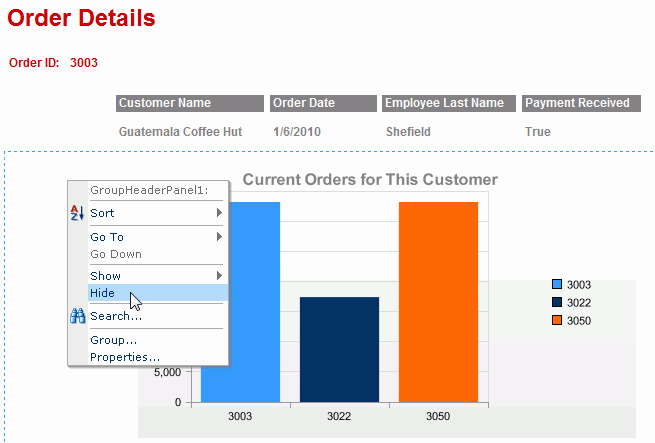
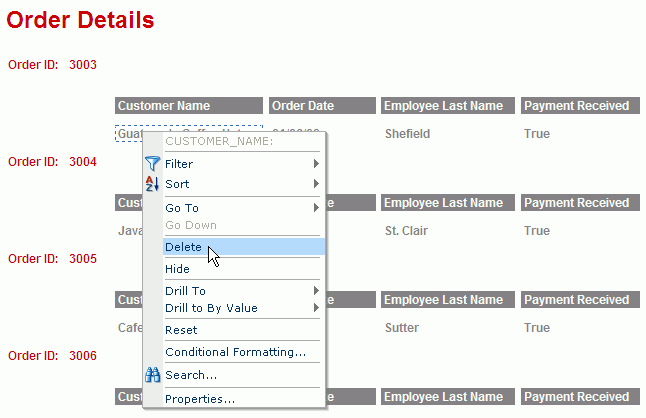
In another way, you can drag any field value outside the report page and drop it, and then click OK to confirm the removal in order to delete the field.
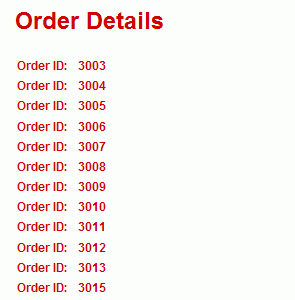
Now the banded object only shows order ID information.
Now the banded object looks like:
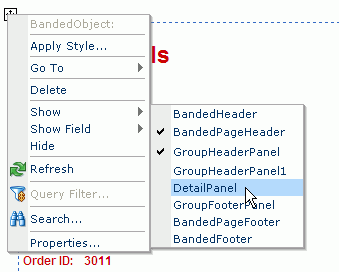
 appears at the upper left corner of the banded object. Right-click the icon and then select Show > DetailPanel from the shortcut menu to show the detail panel of the banded object which was hidden when designing in JReport Designer.
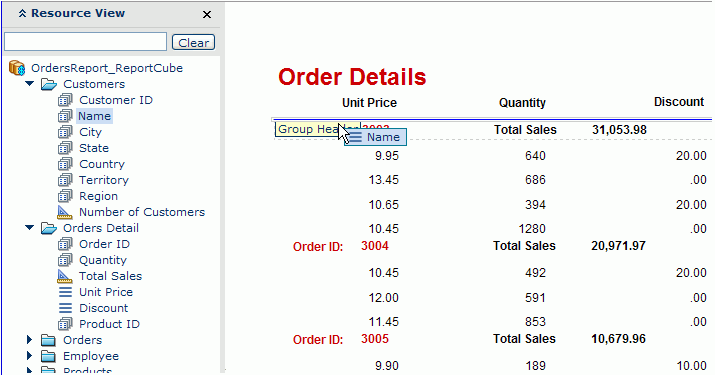
Next, we use the Resource View panel to perform data analysis.
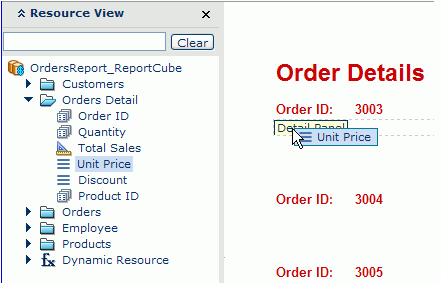
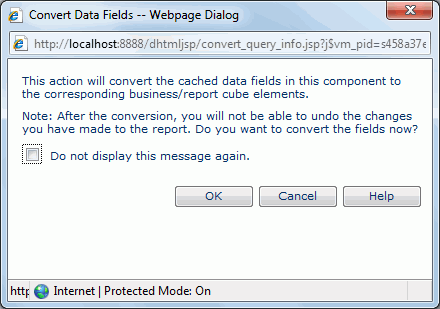
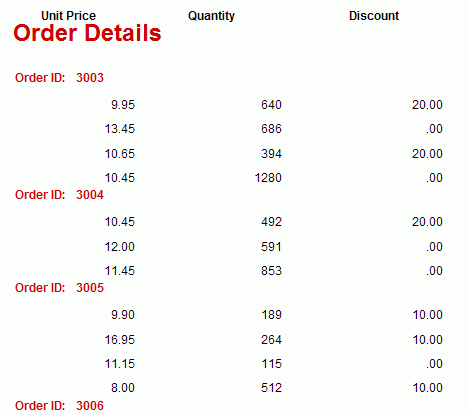
The Convert Data Fields dialog appears. This dialog only appears for the first time you perform data analysis on a component designed in JReport Designer. Click OK to confirm, and the Unit Price information will be presented in the banded object.
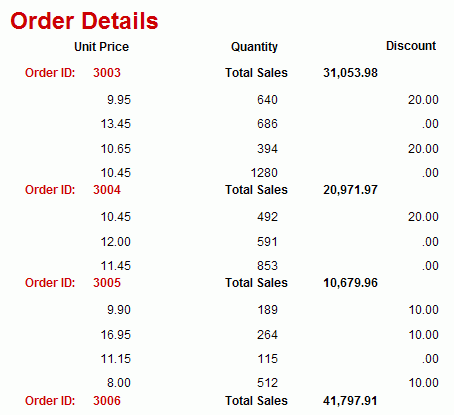
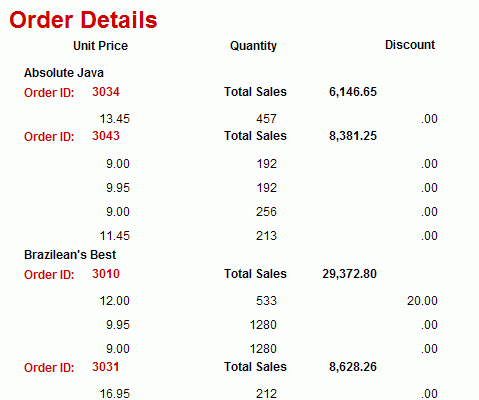
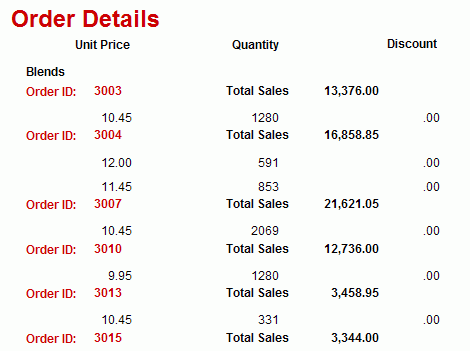
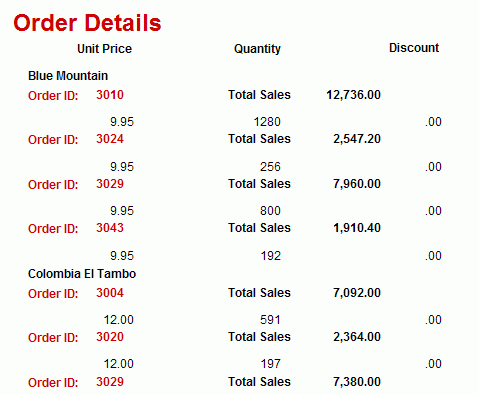
Next, we will group the banded object further by customer name and do some drill actions.
